
Football Metrics: Playing to Learn
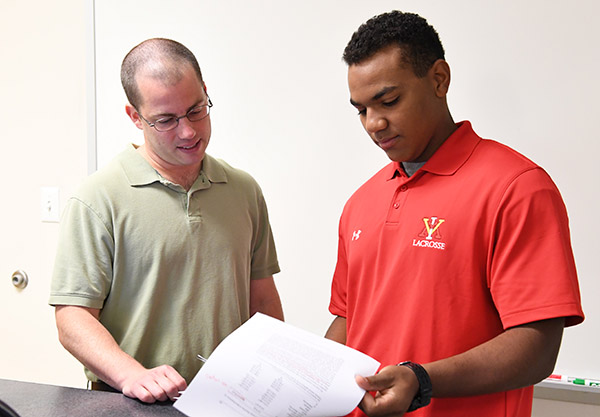 |
| Maj. John David and Christian Nelms ’18 consult just before Nelms’ SURI presentation June 23. – VMI Photo by Kelly Nye. |
LEXINGTON, Va., June 23, 2016 -- Professional sports franchises are always trying to find an edge.
That’s why so many, particularly in Major League Baseball, have embraced a mathematical approach, applying analytics to player performance and spending money accordingly. It would be a good bet that none of them has every tried to do it using a video game, however.
Cadet Christian Nelms ’18 and Maj. John David spent the first summer session taking baseball’s bent for analysis an applying it to the football field. They crunched numbers and ran computer simulations to determine the value, or lack thereof, of certain positions on the football field. The approach was a little unorthodox, and the results have been surprising.
“In some sense, it’s the first study of this type at all,” said David, an assistant professor in the Department of Applied Mathematics.
One of the advanced statistics sweeping the baseball world these days is Wins Above Replacement, which tries to determine, through a formula that encompasses all sorts of batting, fielding and pitching metrics, how much value a team would lose if a player had to be replaced in the lineup. After reading an article in The Journal of Sports Economics, Nelms decided he’d like to apply a similar metric to football. He pitched his idea to the Summer Undergraduate Research Institute, and, after receiving a SURI grant, began his unusual research.
“Maj. David suggested it would be cool to do a project using a video game,” said Nelms, one of two SURI researchers in the applied mathematics department this summer. “From there, I took the idea and ran with it.”
That’s right. Nelms conducted his research using a video game, specifically the popular Madden football. Though the idea may sound far-fetched, it really isn’t that crazy. The article from The Journal of Sports Economics tried to determine how valuable a position is to a football team; Nelms just took it a step further.
“Basically, the project is using the video game to determine positional wins above replacement ratings in the NFL,” said Nelms.
Inspiration struck, David said, as he was compiling his research on quarterbacks for a chapter he wrote for a sports analytics book that will be released in January.
“It kind of occurred to me that maybe this game, which is basically a computer simulation, might be able to tell us something that some of the other studies or data shortcomings [cannot],” David said. “With this idea, what we could do is look at the value of each individual player.”
During the first summer session, Nelms ran 1,250 simulations, analyzing five different positions on the football field: quarterback, running back, left tackle, linebacker, and cornerback. The simulations themselves took over 100 hours to complete.
Of course, the computer simulation he used is a video game, designed for entertainment and often far from representative of real life. The game, for example, couldn’t take into account intangibles that may affect the game or a player, but Nelms did his best to make his simulations as realistic as possible.
“At first, it was cartoonish,” said David. “We kind of tweaked the various settings of the game so that the numbers coming out of the season-long simulation matched the numbers of an actual season. We wanted to make it look as real as we could get it.”
Because of time constraints, Nelms ran 10 simulations with a starting player at each position, then ran five more with a replacement. His results were surprising, and much different from the previous study.
“The biggest surprise we found was that the quarterback position influenced a lot fewer wins than we thought it would,” Nelms explained. “Running backs, on the other hand, were much more influential.”
For example, Nelms found that the simulations determined that Marshawn Lynch, a running back for the Seattle Seahawks, was worth between 1.8 and 4.8 wins per season. Adrian Peterson, who carries the ball for the Minnesota Vikings, projected for between .6 and 5.6 victories a year.
In short, Nelms found that the running back position was more valuable than the quarterback, which is widely regarded as the most important position on the field. At the same time, he determined that an often-dismissed position like cornerback carried much more value than usually perceived.
While Nelms’ MWAR – Madden Wins Above Replacement – results are different from traditional findings, his research accomplished its goal.
“The whole goal of this was to better understand harder-to-understand positions,” said David. “We tried to use [the simulations] to understand how valuable these players are.”
Nelms will present his findings at VMI’s undergraduate research symposium this fall, but he hopes to take his research off post as well. Twice over the last three years, VMI cadets have presented research at the Mathematical Association of America and American Mathematical Society’s Joint Mathematics Meeting, the largest such gathering in the country, and Nelms might make the trip to Atlanta for that conference this year. He is also thinking about presenting his findings at a sports analytics meeting somewhere.
“Although our results are different,” said David, “I think there will be some people interested in what we have done so far.”
– Chris Floyd
-VMI-